Personal Grocery Inflation Index
Grocery prices get talked about a lot. But most inflation stats describe averages, not what you actually feel at the checkout. I wanted to know how much prices had really gone up for me.
Over the past two years, I collected every single Albert Heijn grocery receipt through their loyalty program. These weren’t just totals. They were detailed, line-by-line records of what I bought, when, and at what price. After parsing more than 600 receipts into structured data (see the receipt parser project), I set out to model my personal inflation experience using formal CPI logic.
Why I Built It
National CPI is built to reflect a representative consumer. But individuals aren’t representative. We have different habits, preferences, budgets, and behavioral patterns. If inflation is going to shape real decisions, about spending, saving, or even wages, then it makes sense to ask: how much is my cost of living actually rising?
This project was my answer. It wasn’t just exploratory. It was a personal replication of formal index construction, grounded in raw data, and constrained by what’s actually available through grocery receipts.
How I Measured Personal Inflation
I built three custom indices, each using the same underlying data but different logic:
- An expenditure-weighted Laspeyres index, weighted by how much I spent on each product in the base month.
- A frequency-weighted Laspeyres index, which emphasized items I bought most often.
- A total expenditure index that tracks raw monthly grocery spend. This was explored as a practical proxy for rolling baskets, after initial attempts to compute Paasche and Fisher indices proved too volatile and unreliable due to inconsistent product matching. While the total spend index was ultimately also heavily influenced by seasonal patterns and behavioral shifts, it was still included to provide additional context.
All indices were benchmarked against official CPI data for food and non-alcoholic drinks from CBS Netherlands, rebased to April 2023 = 100.
Figure 1: Indexed Inflation Measures (April 2023 = 100)
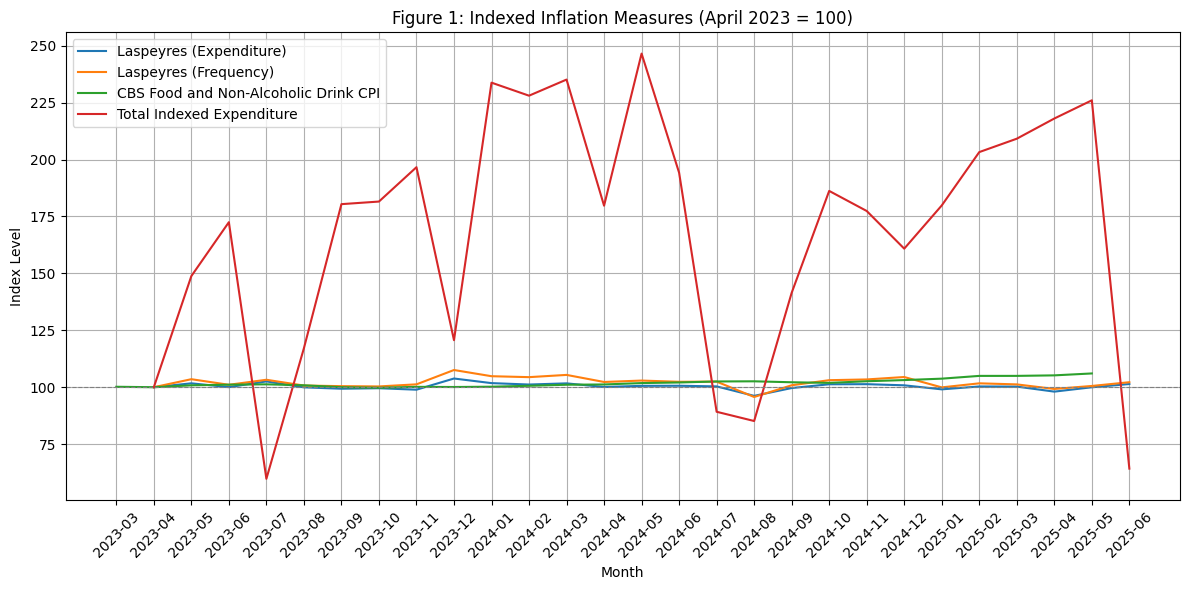
This figure shows all three personal inflation indicators alongside the CBS CPI for food and non-alcoholic drinks. The total expenditure index stands out as the most volatile, with large swings that dominate the chart. These movements mostly reflect behavior. For instance, during vacation periods, overall household spending might stay consistent, but spending at Albert Heijn drops significantly since fewer groceries are purchased. To focus more clearly on price-based patterns, we remove the expenditure proxy in the next figure.
Figure 2: Indexed Inflation Measures Without Expenditure Proxy
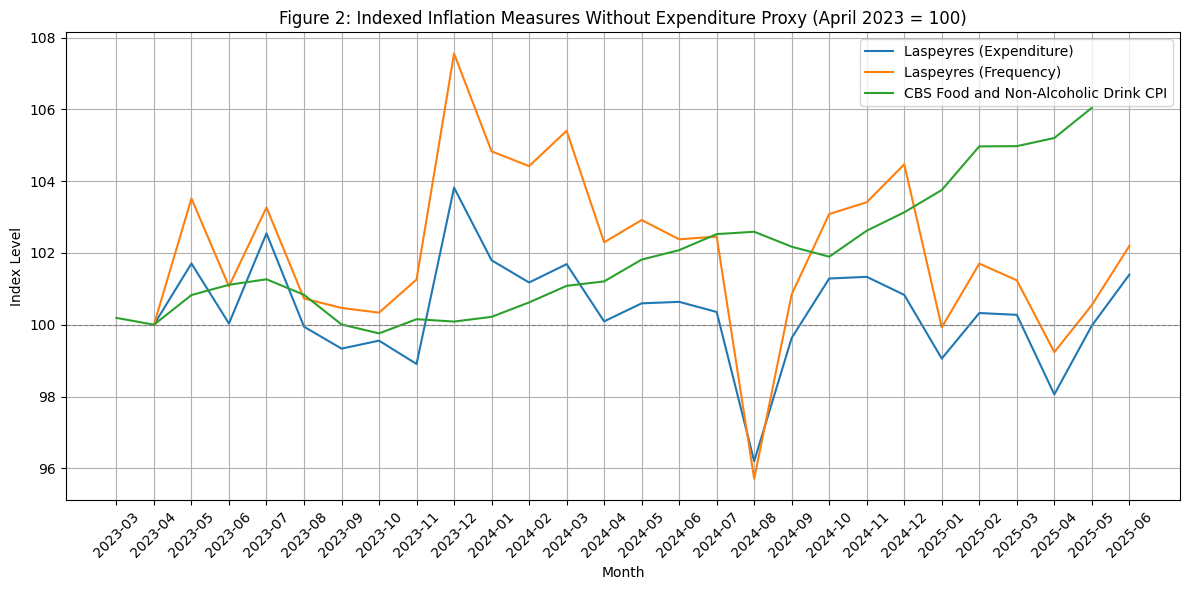
With the expenditure-based index removed, we get a clearer view of how the personal Laspeyres indices compare to official CPI. Both personal indices remain more volatile throughout, but the more surprising result is that they end below the CBS benchmark. This suggests that, based on this specific basket, the household experienced less grocery inflation than reported nationally.
There are a few possible explanations. First, we use a fixed basket from April 2023, which introduces a lot of sensitivity to idiosyncratic product choice. At the individual level, what ends up in the basket can vary widely depending on that month’s habits. Second, the CBS category includes restaurant and take-out food, which likely followed a different inflation path than grocery items. While imperfect, this was the closest available proxy for grocery prices, so it was used for benchmarking.
Figure 3: Month-over-Month Inflation Rates
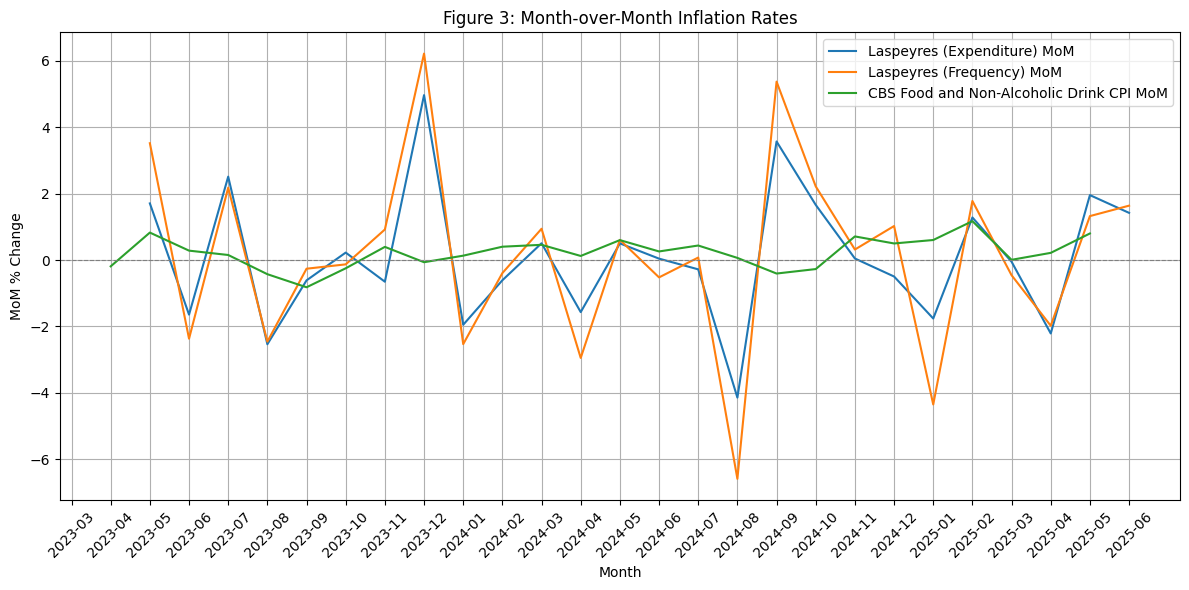
This figure shows the same series as Figure 2, but in terms of monthly inflation rates rather than cumulative price levels. The conclusions are similar. The personal indices remain more volatile than the CBS series, with noticeable spikes and dips. The expenditure- and frequency-weighted Laspeyres indices move closely together, as expected, though the frequency-weighted version shows larger month-to-month changes. This reflects its stronger focus on frequently purchased staples like bread, milk, or fruit.
What Didn’t Work
I initially tried to compute Paasche and Fisher indices. But real receipts are messy. Sparse overlap and inconsistent naming made matching impossible. The results were unstable and meaningless.
I then used total grocery spend as a rough proxy for rolling baskets. But that didn’t separate price effects from behavior changes. It picked up things like holiday travel or bulk shopping, which skewed the signal. I kept it for completeness, but excluded it from most interpretations.
What This Project Shows
- Personal inflation is measurable, but it looks very different from headline CPI. Individual patterns matter.
- Traditional indices like Laspeyres can work at small scale, but they depend heavily on consistent definitions and clean base baskets.
- Some textbook methods, like Fisher or Paasche indices, break down when faced with sparse, messy real-world data.
- This was a modeling project, not a data collection one. It relied on a separate parser to generate clean inputs, and then applied economic CPI logic to household-level data.
Explore the Full Analysis
This page summarizes the key findings and design decisions. If you're interested in the full academic writeup, including methodology, data sources, and references, you can read the complete research notebook as a PDF.
For code, project setup, and replicability, the full repository is available on GitHub.