Voice Deepfake Detection (ASVspoof2019)
Deepfake voices are getting better every year. The line between real and synthetic speech is blurring, and the stakes are rising. Whether it’s for scams, impersonation, or misinformation, voice cloning has real-world risks. But while the technology moves fast, benchmarks don’t. This project was a short sprint to see how far you could get on one of those benchmarks, with minimal resources.
Over a single weekend, I built a working classifier for detecting synthetic audio using the ASVspoof2019 Logical Access dataset. It’s a curated benchmark of real and fake recordings, where “fake” means speech generated by text-to-speech (TTS) or voice conversion (VC) systems. All of these were state of the art back in 2019. That makes it a great clean-room test, but also fundamentally outdated. Even if the dataset had been from 2023 instead of 2019, it would already be obsolete. That’s the pace of the field.
What I Built
I trained a logistic regression classifier on top of Wav2Vec2 audio embeddings. The pipeline:
- Extracted 768-dimensional feature vectors using pretrained
torchaudio.pipelines.WAV2VEC2_BASE - Trained and validated on a balanced set of 500 real and 500 fake samples
- Logged probability histograms and ROC curves to audit model sharpness
- Bundled everything into a CLI interface that can score any .flac file
There was no fine-tuning. No GPU. No optimization tricks. This wasn’t about pushing the state of the art. It was about building something clean and interpretable on a well-scoped classification task. A kind of “can you actually ship something” test.
How It Performed
The model performed almost perfectly, which is exactly why it should not be overinterpreted. These spoofed clips are clean, synthetic voices from a limited set of algorithms that are now several generations behind. Still, the results are a useful sanity check for the basic pipeline.
Figure 1: Predicted Probabilities (Train)
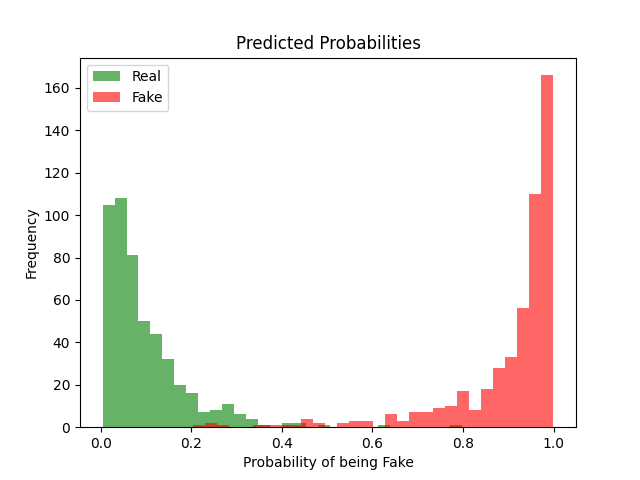
This histogram shows the classifier’s confidence on the training set. Real samples are shown in green, fake ones in red. Most predictions cluster at the extremes, near 0 or 1. That suggests the model is highly confident and finds clear separation in the Wav2Vec2 embedding space. There is minimal confusion in the 0.4–0.6 range.
Figure 2: ROC Curve (Train)
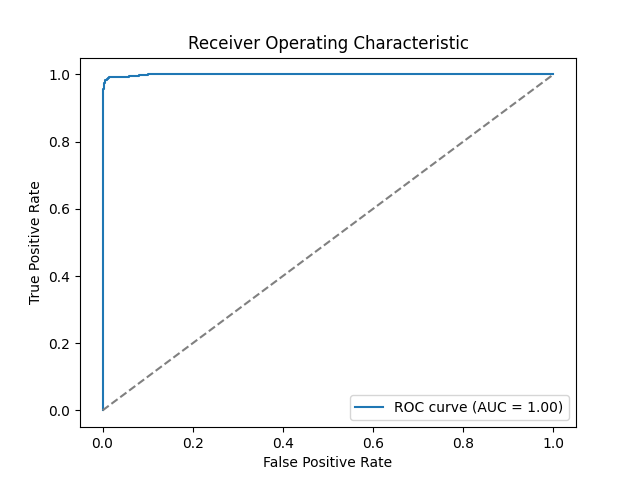
The ROC curve plots true positive rate vs. false positive rate. An area under the curve (AUC) of 1.00 means perfect separation on the training data. That’s not surprising here. The benchmark is clean and the sample size small. But it also reinforces the point that this result says little about robustness in real-world scenarios.
Figure 3: Predicted Probabilities (Validation)
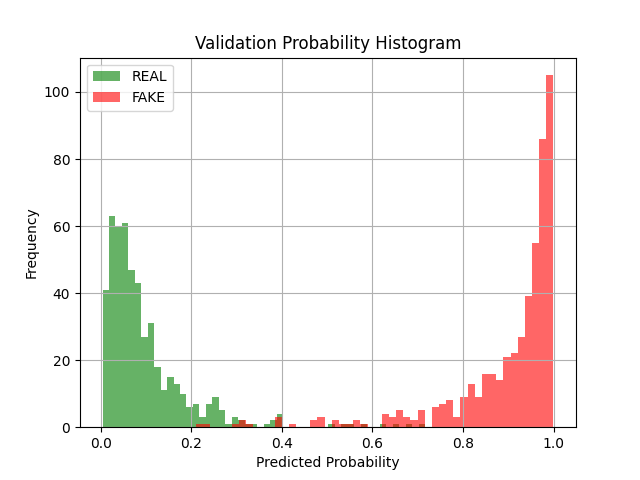
This is the same histogram as Figure 1, but on a held-out validation set. Again, most predictions land confidently at the ends of the scale. There’s a small rise in middle-range scores compared to training, but not much. The model remains sharp, even without tuning.
Figure 4: ROC Curve (Validation)
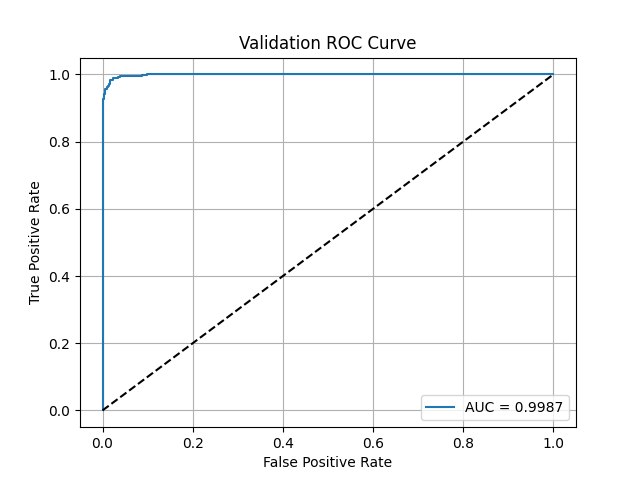
Validation AUC lands at 0.9987. That’s still extremely high. But again, this tells us more about the separability of this benchmark than it does about actual detection capacity in the wild. Real-world voice deepfakes are noisier, more diverse, and often designed to evade detection. None of that is captured here.
Why It Still Matters
- This was not a research contribution. It was a one-day execution test with real constraints: no GPU, no budget, and a tight scope.
- The goal wasn’t novelty. It was clean implementation, quick deployment, and clear signal interpretation.
- The results are limited by design, but they demonstrate a working audio pipeline that translates into CLI inference and testing.
Want to Dive Deeper?
This page gives the short version. For the full project context, including training code, file structure, and testing logic, see the GitHub repository.